The hemoglobin A1c test measures your average blood sugar over the past 2–3 months. Here is exactly what the numbers mean, how the American Diabetes Association classifies each range, and what to do if your result falls above normal.
According to the American Diabetes Association, a normal A1C level is below 5.7% (39 mmol/mol). Prediabetes is defined as an A1C between 5.7% and 6.4% (39–47 mmol/mol). Diabetes is diagnosed at an A1C of 6.5% (48 mmol/mol) or higher on two separate tests. A1C reflects average blood glucose over roughly three months and is the primary test used for both diagnosis and long-term monitoring worldwide.
- What Is A1C and How Does It Work?
- Normal, Prediabetes, and Diabetes Ranges — The Official Numbers
- What Causes A1C to Rise? Key Risk Factors
- Symptoms That Often Accompany Elevated A1C
- How A1C Is Used for Diagnosis and Monitoring
- Treatment Options to Lower A1C
- Diet and Lifestyle Changes That Move the Number
- What Happens When A1C Stays High
- When to See a Doctor About Your A1C
- Frequently Asked Questions
What Is A1C and How Does It Work?
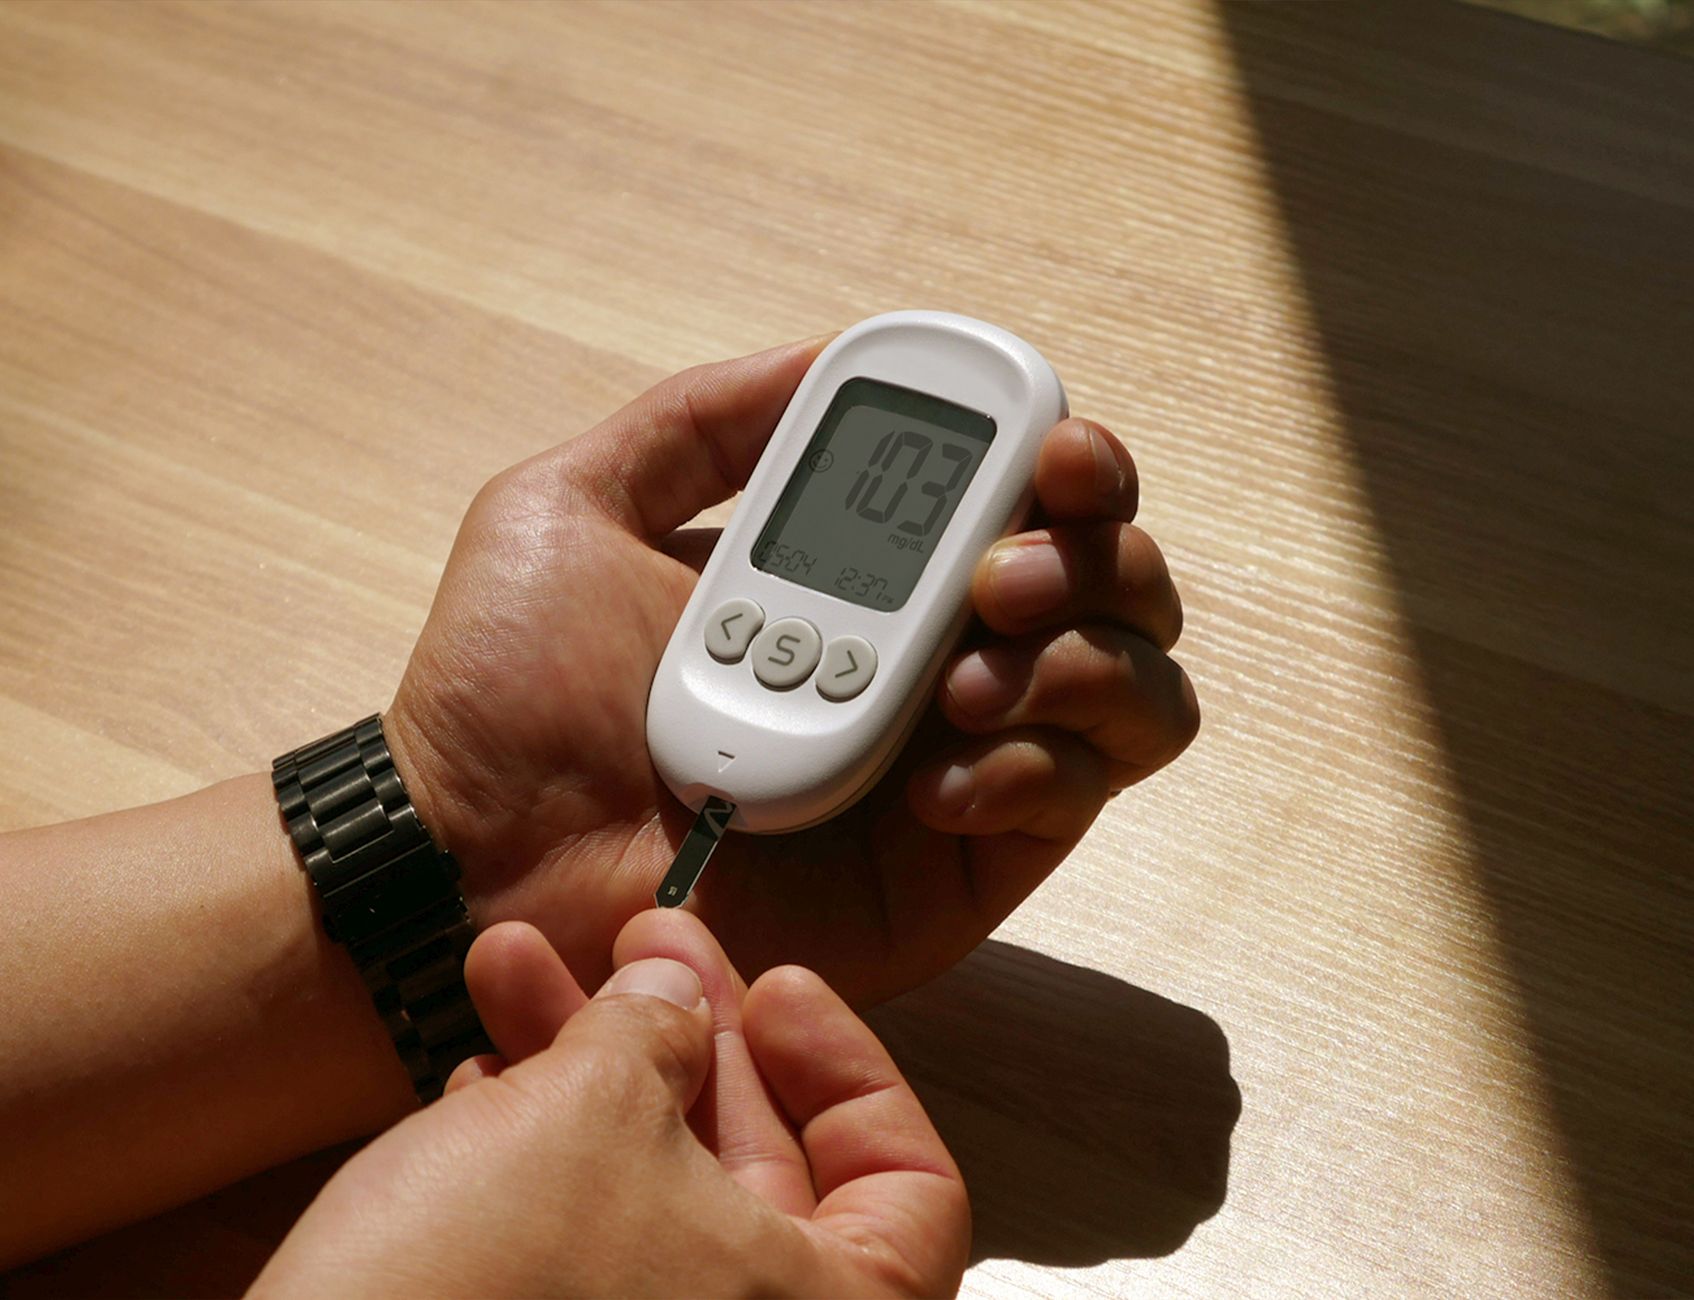
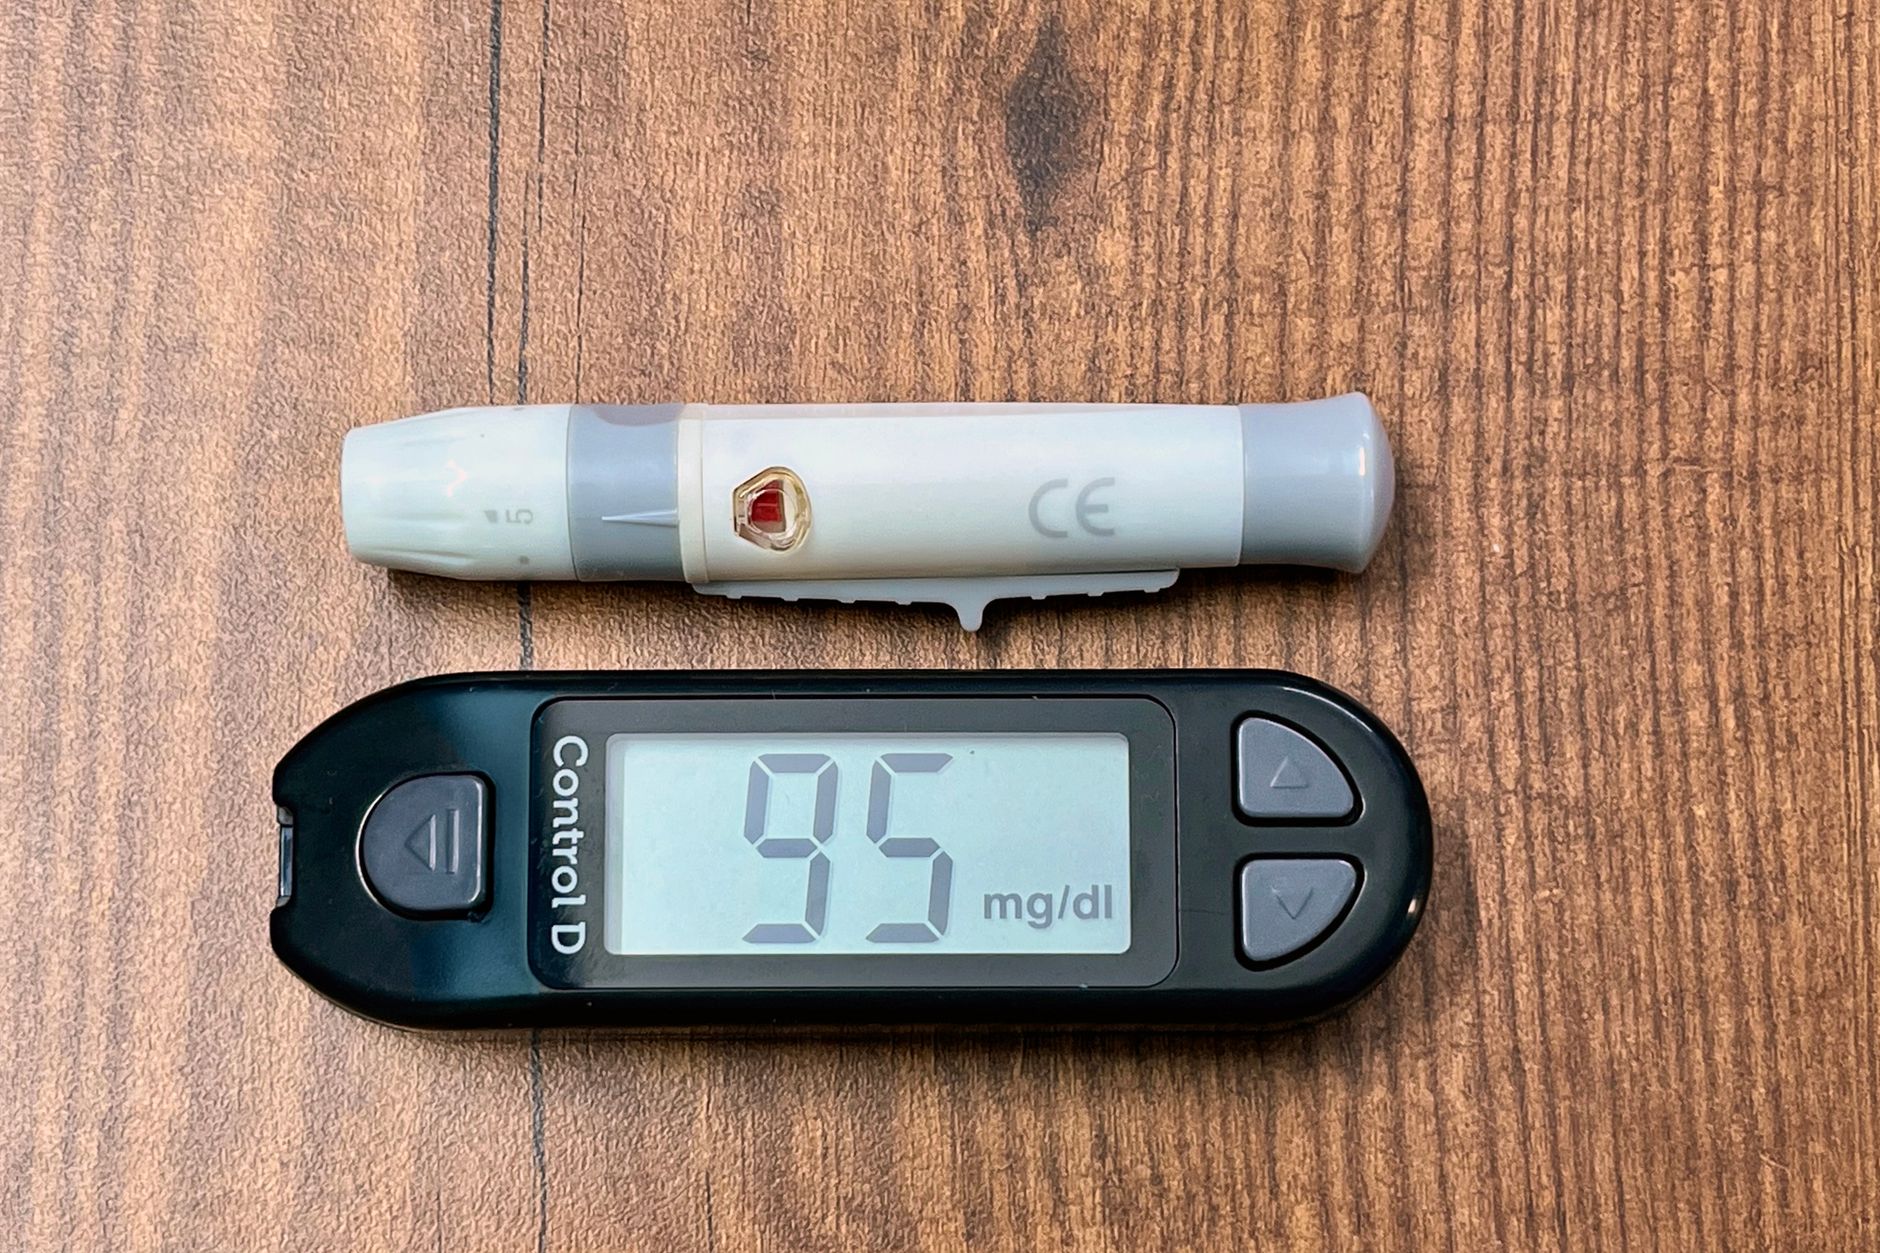
The hemoglobin A1c test — also called HbA1c, glycated hemoglobin, or simply A1C — measures the percentage of your red blood cells that have glucose attached to their hemoglobin protein. Red blood cells circulate for about 90 to 120 days, so the A1C value provides a weighted average of your blood glucose over the preceding 8 to 12 weeks. Unlike a finger-stick glucose check, which captures a single moment, A1C reveals the broader trajectory.
Glucose binds to hemoglobin through a non-enzymatic process called glycation. The more glucose present in your bloodstream over time, the more hemoglobin becomes glycated. A higher A1C percentage therefore signals sustained hyperglycemia. The test is standardized to the National Glycohemoglobin Standardization Program (NGSP) and reported both as a percentage and in mmol/mol (IFCC units).
"A1C is the single most useful metric we have for assessing long-term glycemic control and predicting complication risk."
— American Diabetes Association Standards of Care, 2025
Clinicians rely on A1C for three distinct purposes: screening adults at risk for type 2 diabetes, diagnosing prediabetes and diabetes, and monitoring glycemic control in people already diagnosed. The test does not require fasting, which makes it more convenient than fasting plasma glucose, though certain conditions — anemia, hemoglobin variants, chronic kidney disease, and pregnancy — can affect its accuracy[1].
Normal, Prediabetes, and Diabetes Ranges — The Official Numbers
The American Diabetes Association (ADA) establishes the diagnostic thresholds used by most clinicians in the United States. These cutoffs are based on large epidemiological studies linking A1C levels to the development of diabetic retinopathy and other microvascular complications[2].
| Category | A1C (%) | A1C (mmol/mol) | Clinical Implication |
|---|---|---|---|
| Normal | Below 5.7% | Below 39 | No diabetes; low risk for progression |
| Prediabetes | 5.7% – 6.4% | 39 – 47 | Increased risk for type 2 diabetes; intervention recommended |
| Diabetes | 6.5% or higher | 48 or higher | Diagnosis confirmed with a second test; requires management |
A single result of 6.5% or higher warrants a repeat test — either another A1C or a fasting plasma glucose of ≥126 mg/dL or an oral glucose tolerance test (OGTT) with a 2-hour value ≥200 mg/dL. Only after confirmation is a diabetes diagnosis established. For prediabetes, the ADA recommends annual re-testing and referral to a structured lifestyle intervention program such as the National Diabetes Prevention Program[3].
A1C below 5.7% does not guarantee normal glucose metabolism. Some individuals with normal A1C may have significant post-meal glucose spikes detected only by continuous glucose monitoring. Conversely, conditions like iron-deficiency anemia can falsely elevate A1C, while hemolytic anemia, recent blood transfusion, or advanced chronic kidney disease can falsely lower it.
What Causes A1C to Rise? Key Risk Factors
Elevated A1C reflects sustained hyperglycemia, but the reasons behind it vary widely. Understanding the root cause determines whether the path forward involves lifestyle alone, medication, or both.
Insulin resistance and metabolic syndrome
Cells in muscle, fat, and liver become less responsive to insulin, forcing the pancreas to produce more insulin to maintain normal glucose. Over time, the pancreas cannot keep up, and blood glucose rises. This is the dominant driver of elevated A1C in type 2 diabetes and prediabetes. Risk factors include excess visceral fat, physical inactivity, and a diet high in refined carbohydrates and added sugars.
Insufficient insulin production
In type 1 diabetes, autoimmune destruction of pancreatic beta cells leads to absolute insulin deficiency. In type 2 diabetes, beta-cell function declines progressively over years. When endogenous insulin is inadequate, glucose cannot enter cells efficiently, and A1C rises. People with type 1 diabetes and advanced type 2 diabetes require exogenous insulin to achieve target A1C levels.
Dietary patterns and meal timing
Consistent overconsumption of carbohydrates — especially refined grains, sugary beverages, and ultra-processed snacks — directly raises postprandial glucose and, over weeks, A1C. Even in the absence of diabetes, a diet with a high glycemic load can push A1C into the prediabetes range. Emerging evidence also links late-night eating and irregular meal timing to poorer glycemic control independent of total calorie intake.
Physical inactivity and sedentary behavior
Muscle tissue is the largest consumer of glucose after a meal. Regular physical activity increases glucose uptake via insulin-independent mechanisms and improves insulin sensitivity. Sedentary behavior — sitting for prolonged periods without breaks — is associated with higher postprandial glucose and a graded increase in A1C, even in adults who exercise moderately.
Medications and medical conditions
Certain drugs can raise blood glucose: glucocorticoids, some antipsychotics (olanzapine, clozapine), thiazide diuretics, and some HIV antiretrovirals. Endocrine disorders such as Cushing syndrome, acromegaly, and hyperthyroidism also elevate glucose. Conversely, conditions affecting red blood cell turnover — anemia, hemoglobin variants, recent blood loss — can alter the A1C value independently of true glycemia.
Symptoms That Often Accompany Elevated A1C
A1C rises gradually, often over years. In the prediabetes range, most people have no symptoms at all — which is why screening is essential. Once A1C crosses into the diabetes range, the classic triad of polyuria, polydipsia, and polyphagia may appear, along with other signs.
Many people with an A1C of 6.5% to 7.5% still feel entirely well. The absence of symptoms does not mean the absence of risk — microvascular damage begins well before clinical symptoms appear.
How A1C Is Used for Diagnosis and Monitoring
The ADA recommends screening begin at age 35 for all adults who are overweight or obese, and earlier for those with additional risk factors: a first-degree relative with diabetes, a history of gestational diabetes, high-risk race or ethnicity (African American, Hispanic, Native American, Asian American), or physical inactivity. Testing is repeated every three years if normal, annually if prediabetes is identified.
For people already diagnosed with diabetes, the ADA's general target A1C is less than 7.0% for most non-pregnant adults[2]. More stringent targets (less than 6.5%) may be appropriate for individuals with short duration of diabetes, no significant cardiovascular disease, and a low risk of hypoglycemia. Less stringent targets (less than 8.0%) are often appropriate for those with advanced complications, limited life expectancy, or a history of severe hypoglycemia.
The frequency of A1C monitoring depends on whether glycemic goals are met. The ADA recommends testing at least twice per year for patients who are meeting treatment goals and have stable glycemic control, and quarterly — every 3 months — for those whose therapy has changed or who are not meeting goals. Home A1C test kits are available but should not replace lab-based testing for diagnostic decisions.
Treatment Options to Lower A1C
The treatment strategy for elevated A1C depends on the category and underlying pathophysiology. For prediabetes, lifestyle intervention is the cornerstone. For diabetes, a stepped approach combining lifestyle change, oral medications, injectable therapies, and insulin is typical.
Prediabetes: Lifestyle First, Metformin Second
The landmark Diabetes Prevention Program trial showed that a 7% weight loss combined with 150 minutes of moderate physical activity per week reduced the risk of progression to type 2 diabetes by 58% — and by 71% in adults over age 60[3]. Metformin is considered for prediabetes in individuals under age 60 with a BMI ≥35 kg/m², women with prior gestational diabetes, or those with progressing A1C despite lifestyle efforts.
Type 2 Diabetes: A Stepped Pharmacologic Approach
First-line therapy for type 2 diabetes is metformin, unless contraindicated. If A1C remains above target after 3 months, combination therapy with a second agent — typically an SGLT2 inhibitor (empagliflozin, dapagliflozin), a GLP-1 receptor agonist (semaglutide, tirzepatide), or a DPP-4 inhibitor — is added. The ADA now recommends SGLT2 inhibitors or GLP-1 receptor agonists preferentially in patients with established cardiovascular disease, heart failure, or chronic kidney disease, independent of baseline A1C[2].
Meta-analyses report that lifestyle modification alone lowers A1C by 0.5–1.0% on average. Metformin typically reduces A1C by 1.0–1.5%. Newer GLP-1 receptor agonists and tirzepatide can lower A1C by 1.5–2.5% in clinical trials, depending on the dose and baseline level.
Type 1 Diabetes: Insulin Is Essential
People with type 1 diabetes require lifelong insulin therapy — either multiple daily injections or continuous subcutaneous insulin infusion via an insulin pump. The goal is to match insulin delivery to carbohydrate intake and activity patterns to maintain A1C below 7.0% without causing frequent or severe hypoglycemia. Adjunctive use of pramlintide or SGLT2 inhibitors (off-label in many regions) may be considered in selected cases.
Diet and Lifestyle Changes That Move the Number
No medication outperforms consistent diet and lifestyle modification for sustained A1C improvement. The question is not whether lifestyle works — it does — but which specific changes produce the greatest drop for each individual.
Carbohydrate reduction is the single most powerful dietary lever. Reducing total carb intake — especially refined carbohydrates and added sugars — lowers postprandial glucose excursions and reduces the glycemic burden on the pancreas. A moderate carbohydrate-restricted diet (130–150 g per day) typically lowers A1C by 0.5–1.0% over 3 to 6 months, while a very low-carbohydrate or ketogenic diet (20–50 g per day) can produce reductions of 1.5% or more, particularly in the first year.
Protein and fiber improve satiety and blunt post-meal glucose spikes. A meal containing at least 25–30 g of protein and 8–10 g of fiber produces a significantly lower glucose peak than a carb-dominant meal with the same total calories. Non-starchy vegetables, legumes, nuts, seeds, and lean animal proteins should form the foundation of each meal.
Structured physical activity — at least 150 minutes per week of moderate-intensity aerobic exercise (brisk walking, cycling, swimming) combined with two resistance-training sessions — improves insulin sensitivity and lowers A1C by 0.3–0.6% on average. The effects are additive; combining aerobic and resistance training yields greater A1C reduction than either modality alone.
Replace one sugary beverage per day with water. Walk for 15 minutes after meals. Include a protein source at every meal. Sleep at least 7 hours per night — poor sleep quality is independently associated with higher A1C. Make one change at a time and build momentum rather than attempting an overhaul overnight.
What Happens When A1C Stays High
Chronic hyperglycemia damages blood vessels and nerves. The relationship between A1C and complication risk is continuous — there is no sharp threshold above which damage suddenly begins. The UK Prospective Diabetes Study (UKPDS) established that every 1% reduction in A1C lowers the risk of microvascular complications by approximately 37%[4].
Microvascular complications arise from damage to small blood vessels. Diabetic retinopathy remains the leading cause of preventable blindness in working-age adults. Diabetic kidney disease (nephropathy) affects about 20–40% of people with diabetes and is the leading cause of end-stage renal disease in the U.S. Diabetic neuropathy causes pain, numbness, and loss of protective sensation in the feet, leading to foot ulcers and amputations.
Macrovascular complications involve larger arteries. Atherosclerosis progresses more rapidly with sustained hyperglycemia, raising the risk of myocardial infarction, stroke, and peripheral artery disease. Atherosclerotic cardiovascular disease is the leading cause of mortality in people with type 2 diabetes.
Prediabetes also carries risk. Even in the 5.7–6.4% range, the risk of cardiovascular disease is modestly elevated compared with those below 5.7%, and the annual rate of progression to diabetes is 5–10% without intervention. Lifestyle intervention in the prediabetes window can reduce that progression rate by more than half.
When to See a Doctor About Your A1C
If you have never had your A1C checked and you are 35 or older with overweight or obesity, schedule a test. If you have risk factors — a family history of diabetes, a history of gestational diabetes, or belonging to a high-risk ethnic group — testing earlier is justified.
If your A1C result falls between 5.7% and 6.4%, discuss a structured lifestyle program and consider metformin if you meet the criteria outlined by the ADA. If your A1C is 6.5% or higher on a repeat test, you need a comprehensive diabetes management plan that includes medication, dietary counseling, and regular monitoring.
Frequently Asked Questions
Can I lower my A1C in 30 days?
Yes, measurable improvement is possible within 30 days, especially if you start from a higher baseline. Aggressive carbohydrate reduction, daily physical activity, and consistent sleep can lower A1C by 0.3–0.5% in a month. However, because A1C reflects the previous 8–12 weeks, the full effect of changes takes 2–3 months to appear. A repeat test at 12 weeks gives the most accurate picture of your progress.
Is a 5.6% A1C normal?
Yes, 5.6% falls within the normal range (below 5.7%). It is not considered prediabetes. However, if you have other risk factors for type 2 diabetes — such as obesity, a strong family history, or gestational diabetes — it is still prudent to maintain healthy lifestyle habits. Some clinicians may recommend a repeat A1C in 1–2 years rather than the standard 3-year interval for low-risk individuals.
What does A1C 6.0% mean?
An A1C of 6.0% places you in the prediabetes range (5.7–6.4%). Your estimated average glucose (eAG) is approximately 126 mg/dL. At this level, the 5-year risk of progressing to type 2 diabetes is elevated but can be substantially reduced with lifestyle intervention. The ADA recommends participating in a structured diabetes prevention program and repeating A1C annually.
How often should I check A1C if I have diabetes?
The ADA recommends at least twice-yearly A1C testing for people who are meeting treatment goals and have stable glycemic control. If your therapy has changed or you are not meeting your A1C target, testing every 3 months — quarterly — is appropriate. More frequent testing may be indicated during pregnancy or when starting a new class of glucose-lowering medication.
Can anemia affect my A1C result?
Yes, significantly. Iron-deficiency anemia can falsely elevate A1C by up to 1–2%, because older red blood cells — which carry more glycated hemoglobin — remain in circulation longer. Conversely, hemolytic anemia, recent blood transfusion, or treatment with erythropoietin can falsely lower A1C by introducing younger red blood cells that have had less time to become glycated. If you have known anemia or a hemoglobin variant (such as sickle cell trait), your doctor may use a fructosamine test or continuous glucose monitoring instead.
- Normal A1C is below 5.7%; prediabetes is 5.7–6.4%; diabetes is 6.5% or higher on two separate tests (ADA Standards of Care).
- A1C reflects average blood glucose over the prior 2–3 months and does not require fasting.
- Lifestyle intervention — 7% weight loss and 150 minutes of weekly activity — reduces progression from prediabetes to diabetes by 58%.
- Every 1% reduction in A1C lowers the risk of microvascular complications by approximately 37%.
- Conditions like iron-deficiency anemia and hemoglobin variants can alter A1C accuracy; alternative testing may be needed.
- Treatment targets are individualized: general goal is <7.0%, but less or more stringent targets apply based on age, complications, and hypoglycemia risk.
- American Diabetes Association. "Standards of Care in Diabetes — 2025." Diabetes Care, vol. 48, Supplement 1, 2025. Available at diabetes.org.
- American Diabetes Association. "6. Glycemic Targets: Standards of Care in Diabetes — 2025." Diabetes Care, vol. 48, Supplement 1, 2025.
- Diabetes Prevention Program Research Group. "Reduction in the Incidence of Type 2 Diabetes with Lifestyle Intervention or Metformin." New England Journal of Medicine, vol. 346, no. 6, 2002, pp. 393–403.
- UK Prospective Diabetes Study (UKPDS) Group. "Intensive Blood-Glucose Control with Sulphonylureas or Insulin Compared with Conventional Treatment and Risk of Complications in Patients with Type 2 Diabetes." The Lancet, vol. 352, no. 9131, 1998, pp. 837–853.